Azore’s Built-in Tools for Evaluating Mesh Quality
by Kelly Hile and Dr. Jeff Franklin, P.E.
In Computational Fluid Dynamics, a high quality solution begins with a high quality mesh. Azore is committed to solver integrity, and this starts at the very beginning of the CFD process with mesh quality. Azore has a number of embedded tools to evaluate a mesh and identify low quality cells, so that the solution process can proceed with stability and accuracy. Azore also has complete transparency and full customization when it comes to how the solver mitigates poorer quality cells.
Any methods used for determining mesh quality should be based on the specific type of solver being used. Azore is a second-order solver with cell-centered data storage, a method widely accepted as the best technology to use for both commercial and academic purposes. As such, Azore rewards mesh topologies that promote accuracy in second order solutions and minimize explicit terms that generally lead to solution instability.
Cells Must Be Good Neighbors
The first step in evaluating a mesh is understanding how a solver uses the cell topology to make numerical approximations. How cells are connected to neighboring cells is foundational for most second order control volume discretization schemes. The cell neighbor association is typically used to write all of the spacial discretization relationships. The discretization techniques are composed of both implicit and explicit equation terms. Therefore, an accurate and stable solution depends on well-connected cells, which means that the implicit terms can be maximized, while the explicit terms are minimized.
Cell Connectivity
A control volume solver uses data stored in the centroid of a cell to interpolate a scalar value to the centroid of a neighboring cell. Notice in Figure 1 that the connectivity line in the left cell pair nearly passes directly through the face centroid. Because of the geometry of the connection line and the cell face centroid, a simple linear interpolation method can be used to approximate a face value based on only the cell centroid data on either side of the face. This interpolation relationship is desirable for the control volume method since it results in a cell relationship that has a small computational molecule. When the connectivity line does not pass through the cell centroid, additional assumptions or relationships must be used (typically the introduction of explicit terms) in the control volume discretization. These additional approximations degrade the second order quality and stability.
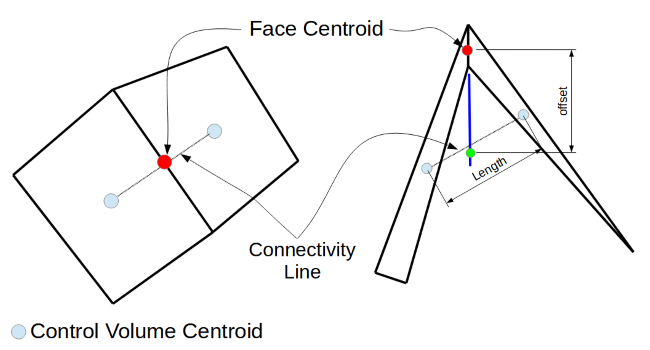
Azore uses the terms strong and weak connectivity to evaluate the quality of the connection between two different cells through a control volume face. A strong connectivity is where the connectivity line passes through the cell face centroid. A weak connection occurs when this line does not pass through the cell face centroid. Azore assigns a numerical value to quantify the strength of a face connectivity, defined as the offset distance divided by the connectivity length. With this definition, a value of 0 would be the highest quality since the offset distance would be zero, and as the offset distances grows with respect to the connectivity length, the quality will deteriorate.
Skewness
Many numerical techniques require the approximation of diffusive fluxes. For control volume methods, the diffusive flux approximations utilize the connectivity vector between neighboring cells. When the connectivity vector between two cell centroids is aligned with the face normal and passes through the face centroid, a fully implicit relationship can be used to approximate the diffusive fluxes. When this cell/face relationship is not available, explicit terms are introduced to approximate the desired diffusive fluxes, degrading the second order nature and the solution stability.
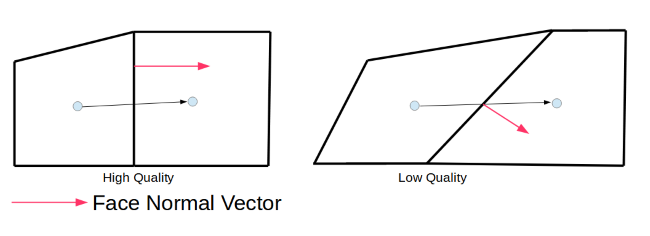
Azore quantifies the skewness of the cell connectivity by taking the dot product between the normalized connectivity and face normal vectors. A skewness value of 1 indicates that the connectivity line and face normal are perfectly aligned (high quality skewness). The skewness values can vary from 0 to 1 where lower values indicate lower quality mesh topologies.
Condition Number
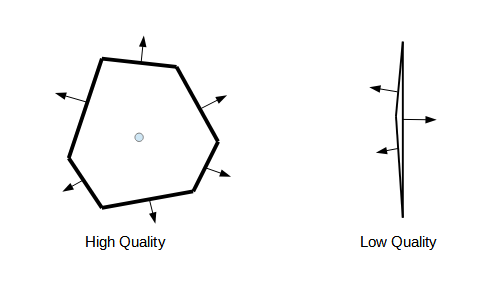
All control volume methods utilize cell-centered gradients that are reconstructed utilizing neighbor cell values. Each cell face provides information about the neighbor cells (see Figure 3). The better the distribution of faces around a cell, the better the variation of known data around the cell. Note that with the poor quality cell (right) the neighbor data variation is only from side to side not top to bottom. Azore quantifies this as the least squares condition number, using the neighbor connectivity lines for a given cell. This number quantifies the quality of the reconstructed second order gradient. A condition number close to zero indicates high quality cell shapes (cells with a good distribution of neighbor cells), whereas a higher condition number indicates a poor quality cell.
Planar Deviation
In three-dimensional mesh topologies, the face between two control volumes must partition the three dimensional space using a two dimensional polygon. In a tetrahedral mesh topology, each face of the cell is characterized by three points, therefore a perfect plane by definition. In mesh topologies that use more than three points to define the polygon between two cells, it is not guaranteed to be planar.
Typical second order discretization schemes assume that each control volume surface is planar, which is part of the fundamental definition of the control volume derivation. If the surface is not planar, then the second order discretization approach begins to degrade since the surface normal is not constant over the entire surface. With this in mind, Azore evaluates the planar deviations for each cell face in the mesh.
Azore calculates planar deviation in a series of steps:
- Calculate the area weighted centroid of the polygon representing the face
- Use the area weighted centroid and each line segment forming the face polygon to form triangles that can be used to calculate the area weighted average normal of the face.
- Sweep through the line segments again and compare the individual normal of each triangle with the average normal. Record the normal that deviates the most from the average normal.
- The planar deviation is one minus the dot product of the area average normal and the largest normal deviation.
True planar faces have a planar deviation of 0 (high quality). Faces that are bent at a right angle have a planar deviation of 1 (low quality).
Flow Aligned Faces
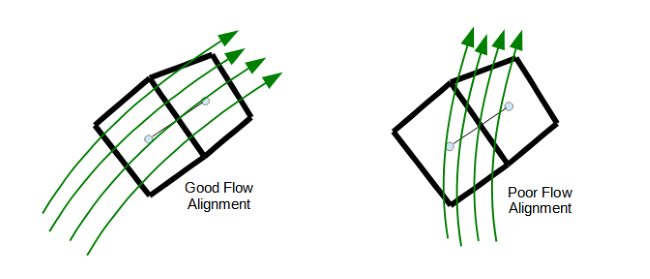
Flow aligned faces provide a very desirable mesh characteristic for CFD applications since this type of mesh topology significantly reduces a numerical degradation typically referred to as “false diffusion.” Meshing experts are well aware of these benefits and frequently take advantage of meshing methods to generate quadrilateral mesh topology in areas of the domain that have a well known flow directionality. Figure 4 shows graphically the desired face orientations to reduce false diffusion and improve gradient calculations in CFD applications by aligning cell faces with the fluid velocity field. Many times, flow-aligned meshes can be generated based on intuition and a general understanding of the flow path through a particular geometry. This mesh quality metric can only be evaluated after a solution has been calculated. However, it is important to note that many flow paths have a dominate flow direction, and it is good practice to choose meshing methods that target flow alignment whenever possible.
Using Azore to Locate Bad Cells
Meshing today’s industrial geometries can be challenging. Over the last decade, the availability of high quality Computer-Aided Design (CAD) tools has increased dramatically, enabling engineers to easily create complex CAD geometries with many fine details. Meshing tools and algorithms have not kept pace with these rapid CAD advances. As a result, a meshing expert must often start the meshing process by de-featuring the complex CAD geometry in order that the meshing software can successfully be used. De-featuring a CAD model requires human labor and a meshing expert must often make trade-offs. More time spent de-featuring typically results in a better quality mesh.
The following example shows how Azore can be used for mesh quality processing. The video shows a model of complex geometry that has been minimally de-featured. Azore identifies low quality cells and visualizes them in their locations relative to the model geometry.
With these tools, meshing experts can easily locate cells that could have an impact on solution accuracy and stability.
Watch the tutorial:How to Find Bad Cells in a Mesh