Making Design Choices with CFD Predictions: A Simple Way to Quantify Velocity Uniformity
By Dr. Jeffrey Franklin, P.E.
One of the more common design objectives for a fluid flow system is the uniform normal velocity profile. This type of fluid velocity profile is very desirable in many manufacturing systems since it will typically result in better product uniformity, lower system energy losses, and lower maintenance costs, to name just a few of the benefits provided.
AZORE is a great resource for exploring fluid design concepts virtually on the computer using Computational Fluid Dynamics (CFD). With AZORE, various design concepts can be explored to determine which might be the best one to choose as a final design. To help explain how this design process works within AZORE, consider the flow of a fluid through a 90 degree elbow as shown in the graphic below.
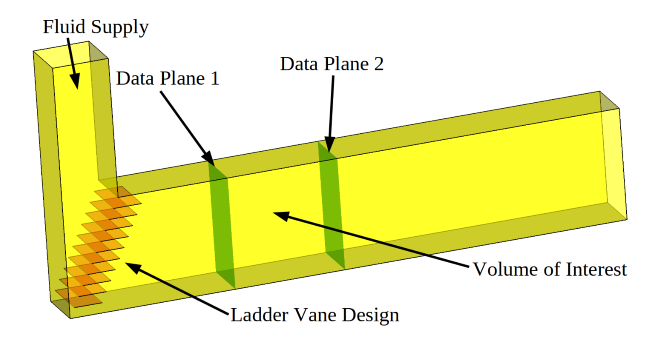
Here a fluid is supplied to the system as shown by the arrow labeled Fluid Supply. We are interested in evaluating flow control devices in the 90 degree elbow to improve the fluid velocity uniformity through the Volume of Interest.
For this discussion we will keep things simple and consider three simple but different design concepts:
- No vanes
- A set of vanes configured like a ladder, frequently referred to as ladder vanes
- A reduced set of vanes (remove every other vane shown in the image above)
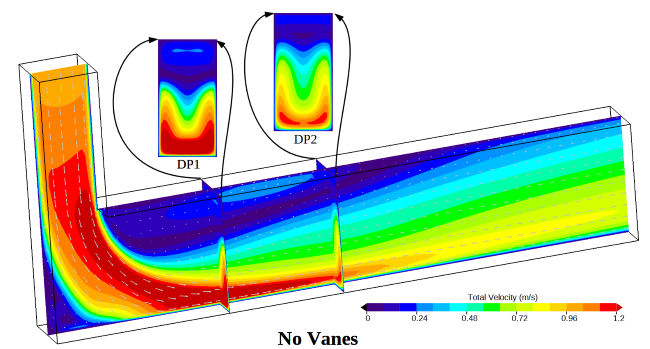
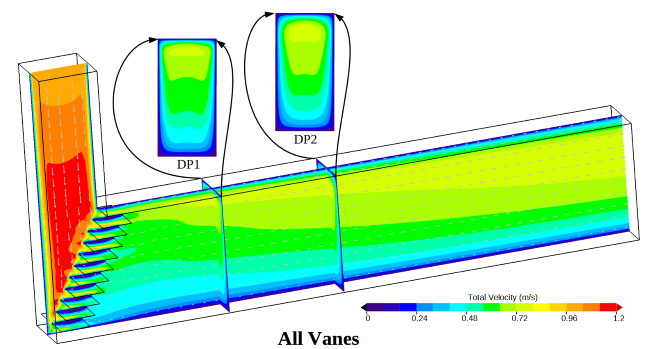
The images below show CFD predictions for each of these cases. Color contours of the total fluid velocity on the center line of the duct are shown for each design. Small vectors are also included to highlight the local direction of the fluid. The total velocity of the fluid passing through each data plane is also shown along with a normal projection view of these contour data.
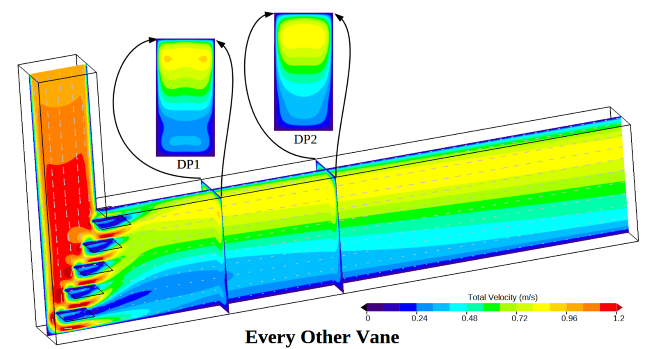
The question now is how should these designs be evaluated? For this case, we are interested in the velocity passing through the Volume of Interest. With this goal in mind, we choose to evaluate the fluid velocity uniformity as it passes through “Data Plane 1” as the design criteria. Note that this is the velocity profile entering our Volume of Interest.
One method of making this evaluation is to simply display each normal velocity data plane side by side. A comparison of “Data Plane 1” is shown below. Visual inspection can then be used to determine which design is better.
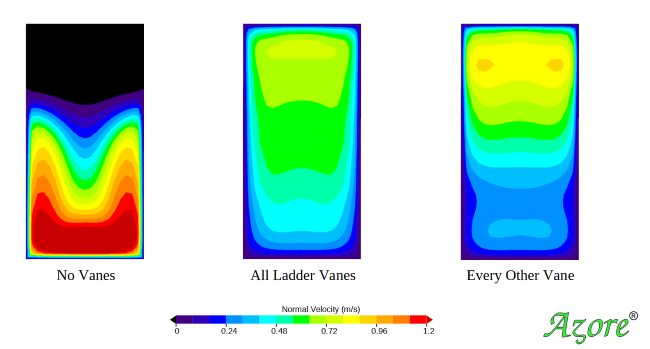
For some people looking at the simulation results, the best design will be obvious, while for others it may not be obvious at all. The people who can tell the differences between each design are performing a visual integration of the color contour fields. In other words, the result with more surface area color bands that are closest to the mean velocity will be the best design.
The visual inspection method is occasionally inadequate for determining which design is better than another design because it lacks the ability to quantify each design in some way. Furthermore, when two different designs result in similar contour fields, it can be difficult to determine which design is truly better than another. Another problem with visual inspection is that it can be impacted by a the range used by the color bar. Consider if a very large color bar range is used. This choice will effectively reduce the number of color bands, making the results look more uniform. Conversely, if a tighter color bar range is used, it can make the variation seem significant.
For a thorough analysis of results, CFD practitioners must utilize statistics-based surface integration methods to calculate a single value. This value can then be used to quantify the velocity uniformity. There are many statistical values that quantify uniformity, and they go by many different names depending on the mathematics of the calculations and the industries where the values are used. For this article, the value will simply be called a Velocity Uniformity Coefficient (VUC).
AZORE simulation results can be easily used to determine statistical information since the colorful CFD images are actually graphical representations of data distributed over a surface. This data can also be used to calculate statistical data such as the VUC.
Let’s start by looking at the raw simulation data on “Data Plane 1” for the Every Other Vane case. This data is shown on the left hand side of the image below. Here each sub grid face (f) is shown and colored by the normal fluid velocity passing through that single sub grid face. The collection of these sub grid faces can be used to calculate the VUC value for this surface using the equations shown to the right of the simulation data.
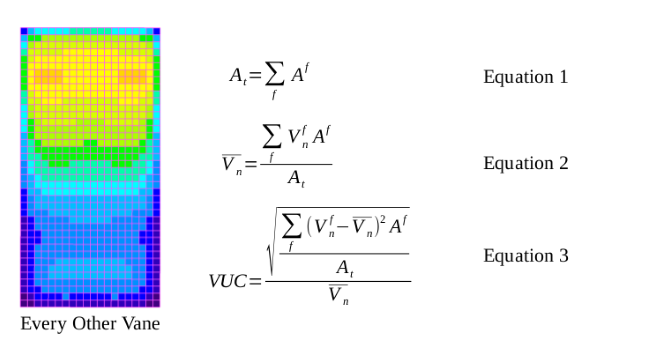
Equation 1 represents the total surface area of the data plane by adding up the area of each sub grid face area. Equation 2 represents the area weighted average normal velocity passing through the data plane. Equation 3 is the VUC for the data plane.
The VUC has several desirable qualities:
- Its value becomes larger as the normal velocity distribution varies from the average normal velocity. Therefore, larger values will indicate less uniform velocity and smaller values will indicate a more uniform velocity. This provides a single value that can be used to evaluate different designs.
- Variation in the mesh length scale is accounted for since the sub grid face area is used for weighting. This means that the calculated values will be independent of the mesh length scale. Therefore, the same values will be reported for a coarse or a fine sub grid.
- Normalization by the average velocity passing through the data plane allows the VUC value to be fluid flow rate insensitive. This allows the VUC quantity to be used to evaluate uniformity even when the fluid flow rate might change in the system.
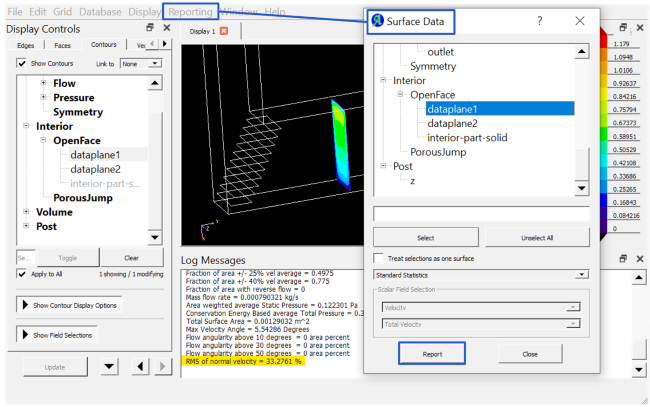
Most CFD tools provide some means for exporting the surface sub grid face data. These data can then be imported into a spreadsheet and the VUC values can be calculated using the provided equations. However, AZORE provides these calculations directly in the user interface, which are easily accessible under the Reporting menu.
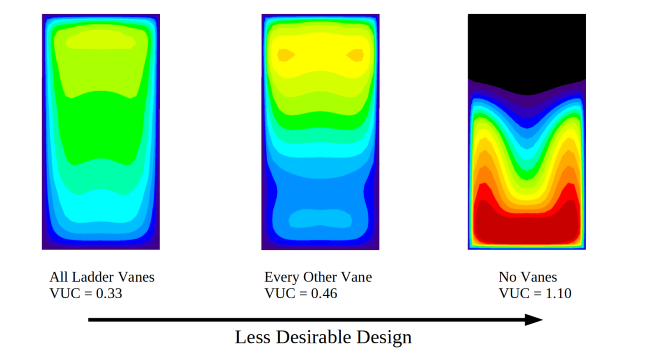
In the following image, the three designs have been sorted using the VUC value calculated for each data plane. The left hand shows the most desirable design with a VUC of 0.33 and the right hand side shows the least desirable design with a VUC of 1.10. Since each design has been assigned a single value it is easy to see adding vanes to the elbow has a pronounced impact on the velocity variability. The difference between the two vane designs, however, only indicates a secondary change in the velocity uniformity compared to the no vanes case.
With AZORE, the uniformity of the velocity profile can be quickly and easily assessed for any data plane or surface. AZORE is an ideal tool for evaluating various design options prior to real-world implementation, combining high performance computing with built-in analytics.