Engineering Challenge
Air flow through a 180° U bend square duct is a classic case documented by Choi, Moon, and Yang [1], with experimental data accessible via the ERCOFTAC Classic Database. This pipe geometry is known to create counter rotating vortices in the flow structure.
Azore Solution
Existing experimental data was compared to the Azore simulation results, along with the results from a well-known commercial CFD package. The same mesh topology was used with the other commercial package along with the same settings for turbulence and other numerical settings. Both CFD tools make similar predictions that represent the general flow structure.
Introduction
This simulation is inspired by the experimental work of Choi, Moon, and Yang [1]. Choi et al. collected data for air passing through a 180° U bend square duct. These data collected from their experiments are compiled and made available through the ERCOFTAC Classic Database. The geometry of the models used in this simulation are presented in Figure 1.
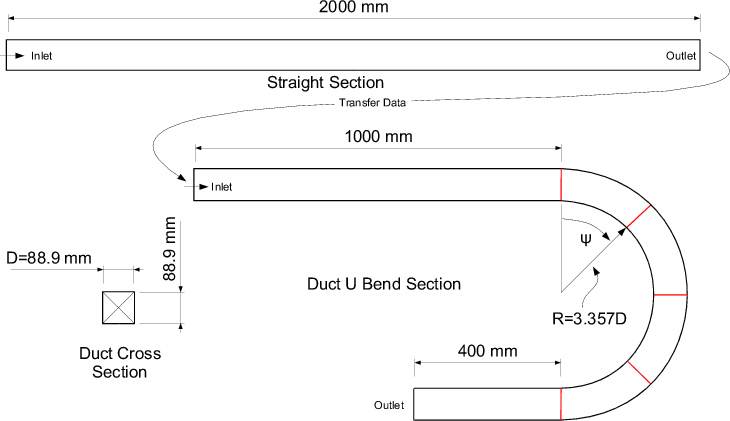
Figure 1
The simulation of this experimental case was broken into two models. The first model was used to establish a fully developed turbulent velocity profile via a long straight section of square ducting. The second model utilizes the outlet velocity and turbulence profiles from the straight run as the inlet boundary condition for the 180° bend model. This case highlights the development of counter rotating vortices, see Figure 2, that typically occur in this type of pipe geometry. This flow structure develops as the curvature of the U bend geometry forces the fluid passing through it to change direction. Some of the fluid accelerates to the outside of the duct curvature resulting in the counter rotating vortex shown in Figure 2.
Figure 2 shows a cutting plane at the center of the duct, the color contours represent total fluid velocity. Figure 3 is a cutting plane at ψ=90, as indicated in Figure 2.
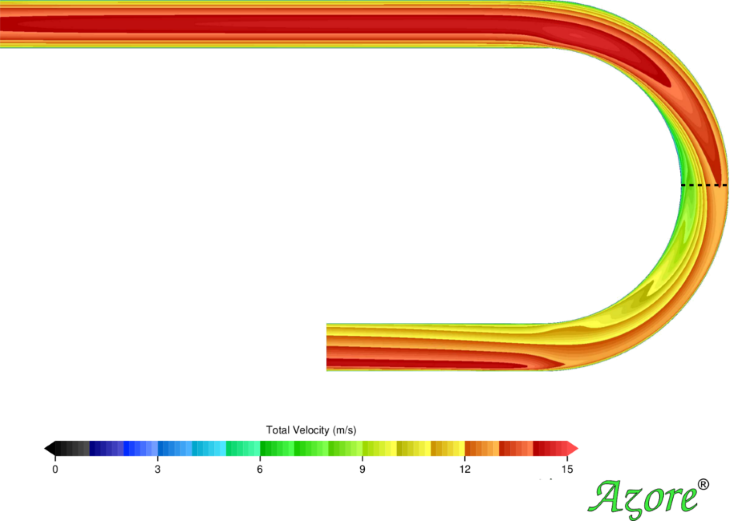
Figure 2
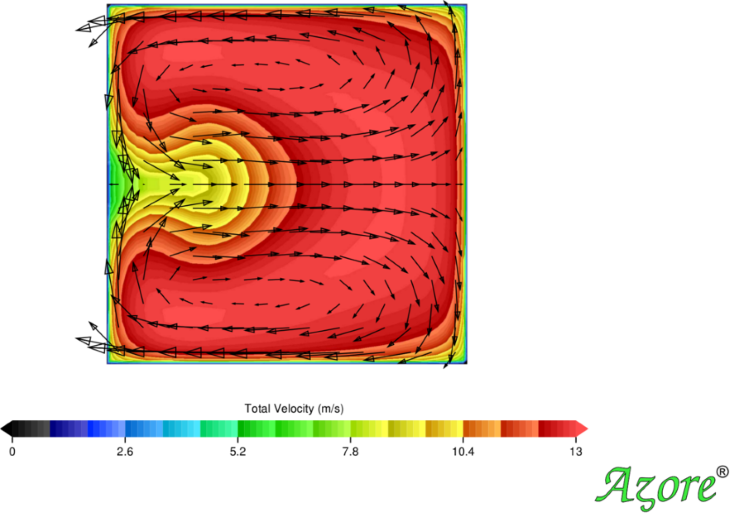
Figure 3
Model Setup
The fluid properties are assumed to be standard air (ρ=1.225 kg/m3 and μ=1.7894e-05 kg/(m-s) ). A uniform inlet velocity of 11.9246 m/s was used on the inlet of the straight section model. The inlet velocity is based on an integration of the test data collected by Choi et al. at the inlet section of the test apparatus. A curvilinear mapped mesh topology was used consisting of 943,565 hex cells in the loop section. The full geometry of the duct was modeled even though the solution and the geometry are symmetric about the centerline of the duct. The standard K-epsilon turbulence model was used along with the high Reynolds number wall functions for the closure of the turbulent boundary layer at the wall surfaces. A second order upwinding scheme has been used for the convective treatment along with a least squares treatment for all spatial gradient approximations. A specialized pressure correction algorithm based on the standard SIMPLE algorithm is used for coupling the continuity and momentum equations. A constant pressure boundary condition is used at the exit of both the straight and U Bend models. The simulation was run about 1,000 iterations until all field residuals dropped below 1.0e-5.
Model Results
Choi et al. collected fluid velocity data along five radial lines through the bend section of the duct. The five red lines shown in Figure 1 indicate where Choi et al. collected velocity data. The stream wise velocity was collected and will be used for comparison in this short article. Each image (Figures 4-8) details the velocity results at the centerline of the duct, one for each angular data collection location. The experimental data is presented with circles. Simulation results for Azore are presented along with the results from a well known commercial package for comparison. The same mesh topology was used with the other commercial package along with the same settings for turbulence and other numerical settings. It is interesting to note that some of the simulation results do not match the experimental data exactly but each CFD tool makes similar predictions, and the trends are representative of the general flow structure.
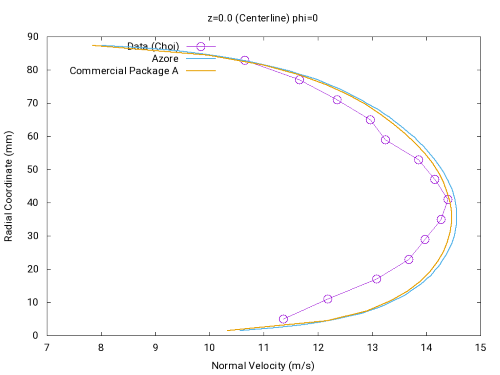
Figure 4
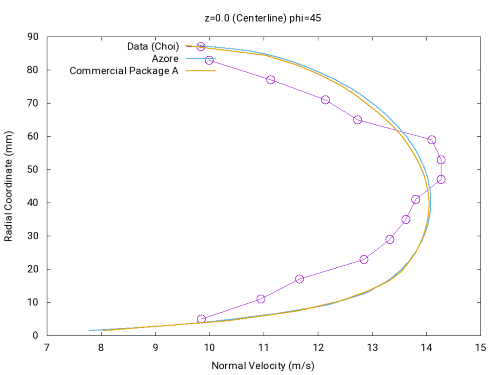
Figure 5
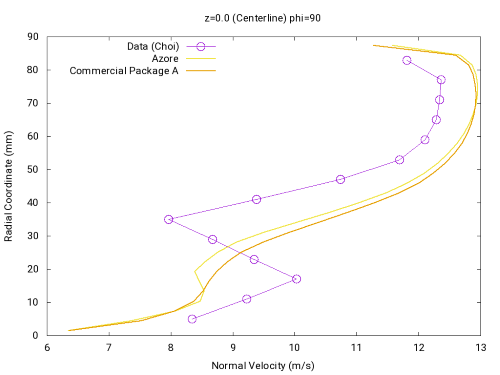
Figure 6
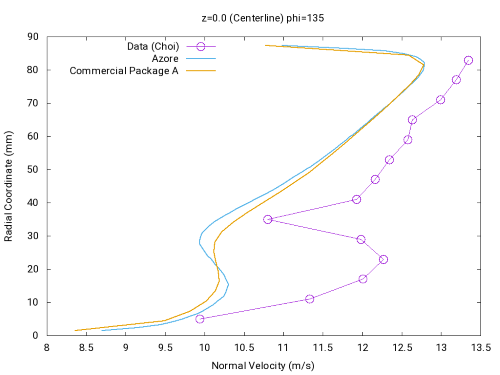
Figure 7
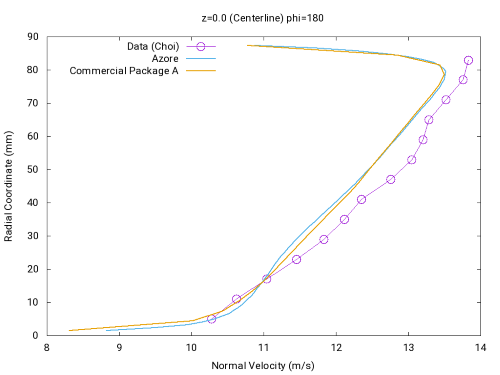
Figure 8
[1].D. Choi, MOON C., and S.H. Yang, Measurement of turbulent flow characteristics of square duct with a 180 degree bend by not wire anemometer, International Symp. on Engineering Turbulenze modeling and measurement, ERCOFTAC, 1990. Part of the Classic Database.
